The second of four instalments. In the first I explained who these numbers describe: one seventh of registered riders, those with at least one top-five finish. Here I answer the question that started the study: at what age do race results say something about the future?
When I began, I was convinced there would be nothing to see at thirteen.
The literature suggested as much, because at younger ages performance is hard to separate from maturation. Common sense said the same: a thirteen-year-old winning an Esordienti race, Italy’s category for thirteen- and fourteen-year-olds, or Under 15s in the literature, may be beating peers a year behind in puberty. Experience agreed. I could think of a long succession of champions at that age who were never heard of again.
I expected to find zero, and to be able to say so precisely. That is not what happened.
Look before modelling
The simplest answer needs no statistics. Take the youngsters who later became professionals, see where they ranked at thirteen, and compare them with everyone else.
Placings are expressed as percentiles: 100 means top of the ranking, 50 the middle and 0 the bottom. This makes seasons and categories with different numbers of riders comparable.
| at thirteen (first-year Esordienti) | typical position |
|---|---|
| riders who will not become professionals | 49th percentile |
| future professionals | 81st percentile |
‘Typical position’ is the median, with half the group above and half below. Professional means having raced for a first- or second-tier team by twenty-five.
At eighteen the gap widens further, from 47 to 94.
There is an elegant way to summarise how far apart two groups are. Take every possible pair consisting of a future professional and a future non-professional, and count how often the professional ranks ahead. At thirteen it happens in 74% of cases, at eighteen in 89%1. On conventional scales, the separation at thirteen lies just above the boundary between medium and large. It is not an enormous signal, but it is very far from the nothing I expected.
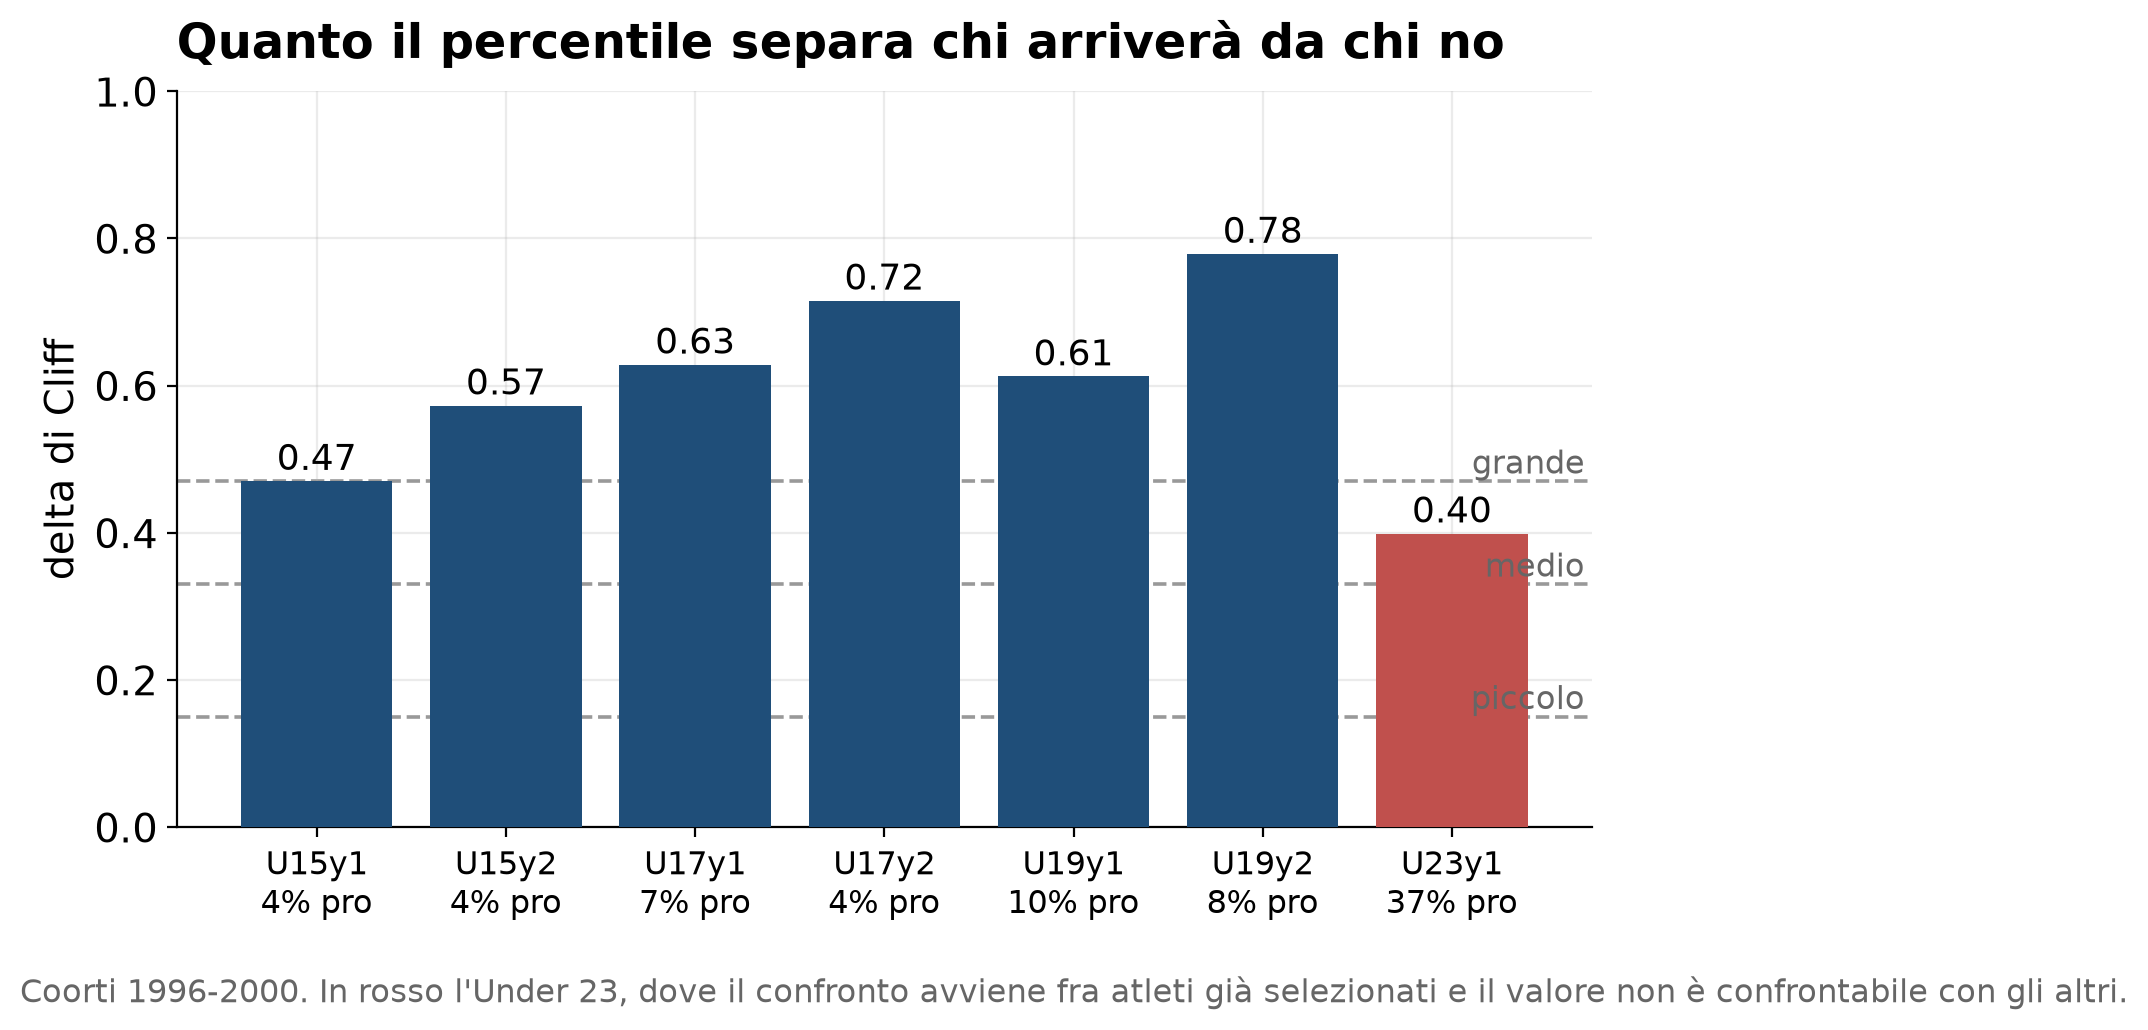
The curves show group medians. Group membership is known only in retrospect: at thirteen nobody knew who was who.
That 74% needs two qualifications, because it is easy to misread.
First, the comparison is among riders ranked that year, not among all youngsters. Anyone who never scored a point at thirteen is absent from both the professional and non-professional groups. The figure describes separation within the ranking; it says nothing about everyone else.
Second, the professionals in this comparison are future professionals: youngsters whose outcomes we know now, but who did not have them written on their foreheads at thirteen. It is a retrospective comparison.
Nor can 74% and 89% be compared directly, because they concern different people. At thirteen the calculation covers everyone ranked then; at eighteen it covers only those still ranked, a much smaller, already selected group. A clean comparison using the same people at every age comes later.
More than a comparison between two groups
There is another way to examine the same data. Instead of dividing riders into those who made it and those who did not, I split them into four groups by how far they went: non-professionals; professionals who never entered the world’s top five hundred; those who reached that group; and those who reached the top hundred of the PCS Ranking on procyclingstats.com.
At thirteen, the medians for the first three groups are 49, 69 and 891. An ordered gradient emerges: the further someone eventually went, the higher they already ranked at thirteen. Random noise does not produce that sort of staircase, which is the main reason I do not think the 74% is an artefact.
The final step breaks the pattern, however. Those who reached the world’s top hundred had a median of 84 at thirteen, below the previous group. There are six riders, a very small sample in which a median can do almost anything.
For more detail in the technical document, in Italian: The gradient by level reached.
Is it performance, or date of birth?
This is the most reasonable doubt to raise, and it needs addressing.
Within a birth year, someone born in January has up to twelve months’ extra development over someone born in December. The data show it clearly: in the Esordienti ranking, first-quarter births are 2.13 times as common as last-quarter births, allowing for Italy’s actual birth distribution2. If a placing at thirteen mostly measured early development, the 74% of pairs in which a future professional ranks ahead would mainly reflect that.
To test it, I rerun the model including relative age, measured in days between birth and year end, and see what happens to the placing effect. Nothing happens. The odds multiplier for ten percentile points is 1.40 before and 1.40 after; discrimination moves from 0.736 to 0.738, a change in the third decimal place. Relative age as the sole predictor reaches 0.513. Essentially a coin toss.
Does being born in January help, then? Very much, but earlier, in entering the ranking: that is what the two-to-one ratio between first and last quarters tells us. Among riders already ranked, birth date no longer distinguishes who will make it. Among professionals the ratio falls to 1.5, against 1.7 among all ranked riders, a gap indistinguishable from chance with 77 athletes. It is an advantage for entering rankings when young, not a measure of talent.
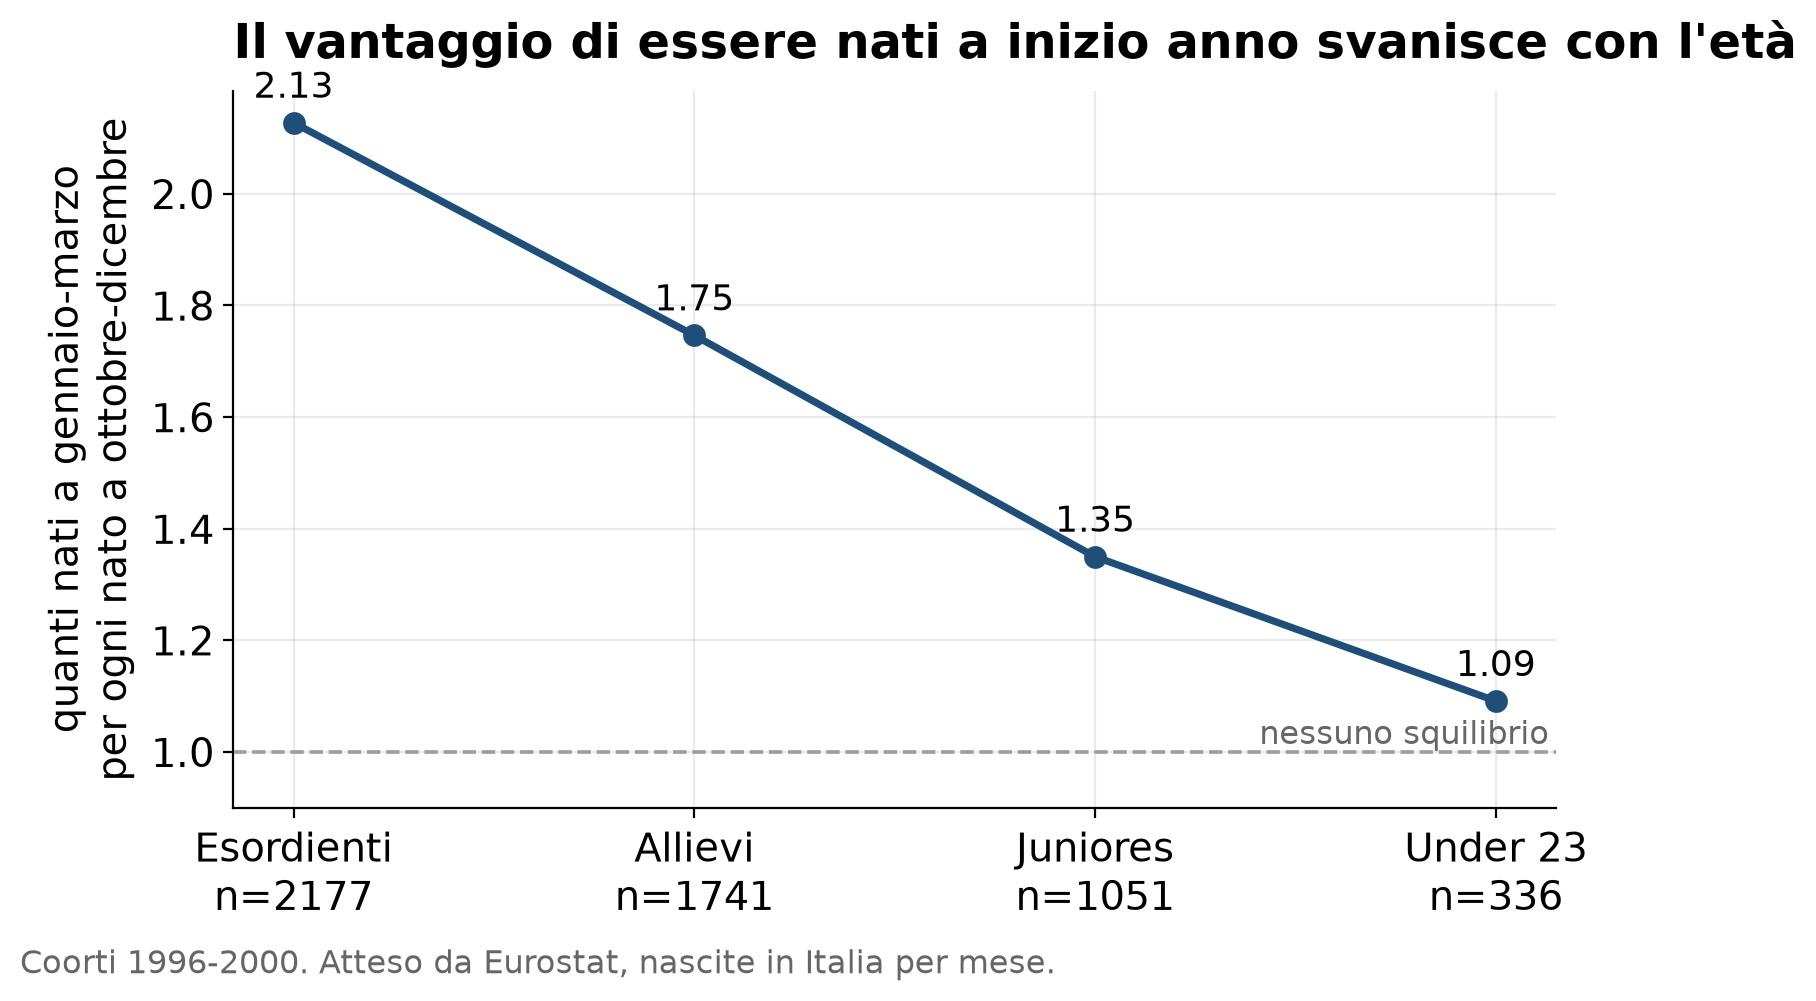
More Italian births occur between May and September, so the expected share is not 25% per quarter. The figure adjusts for actual birth seasonality.
Women’s cycling offers an independent way to test that explanation. It is one of the few questions in this series I can answer in exactly the same way for girls and boys. Prediction questions require knowing who made it, and there is no comparable female outcome, for reasons explained in the fourth instalment (forthcoming); here only birth dates are needed. Girls mature earlier, and by thirteen many have already passed through puberty, while developmental differences among boys born in January and December are at their greatest. If the advantage comes from maturation, it should be weaker among girls.
It is: at thirteen, using the same birth cohorts and demographic expectations, first-quarter births are 1.98 times as common as last-quarter births among boys and 1.51 times among girls. The difference between sexes passes a statistical test (p = 0.007)2. The male figure differs from the earlier 2.13 because this comparison includes only birth cohorts also observed among girls: 5,544 boys and 874 girls.
After fourteen, however, the lines stop resembling each other. That part does not fit. Among boys the imbalance decreases category by category. Among girls it falls faster, becoming indistinguishable from demographic expectations among Allieve (1.20, p = 0.14), before rising among juniors to 1.42, once again distinguishable. With 681 and 370 riders, those estimates have wide intervals, and I would build nothing on them. Only the thirteen-year-old comparison supports reasonably confident conclusions: 874 girls and a clear difference from boys.
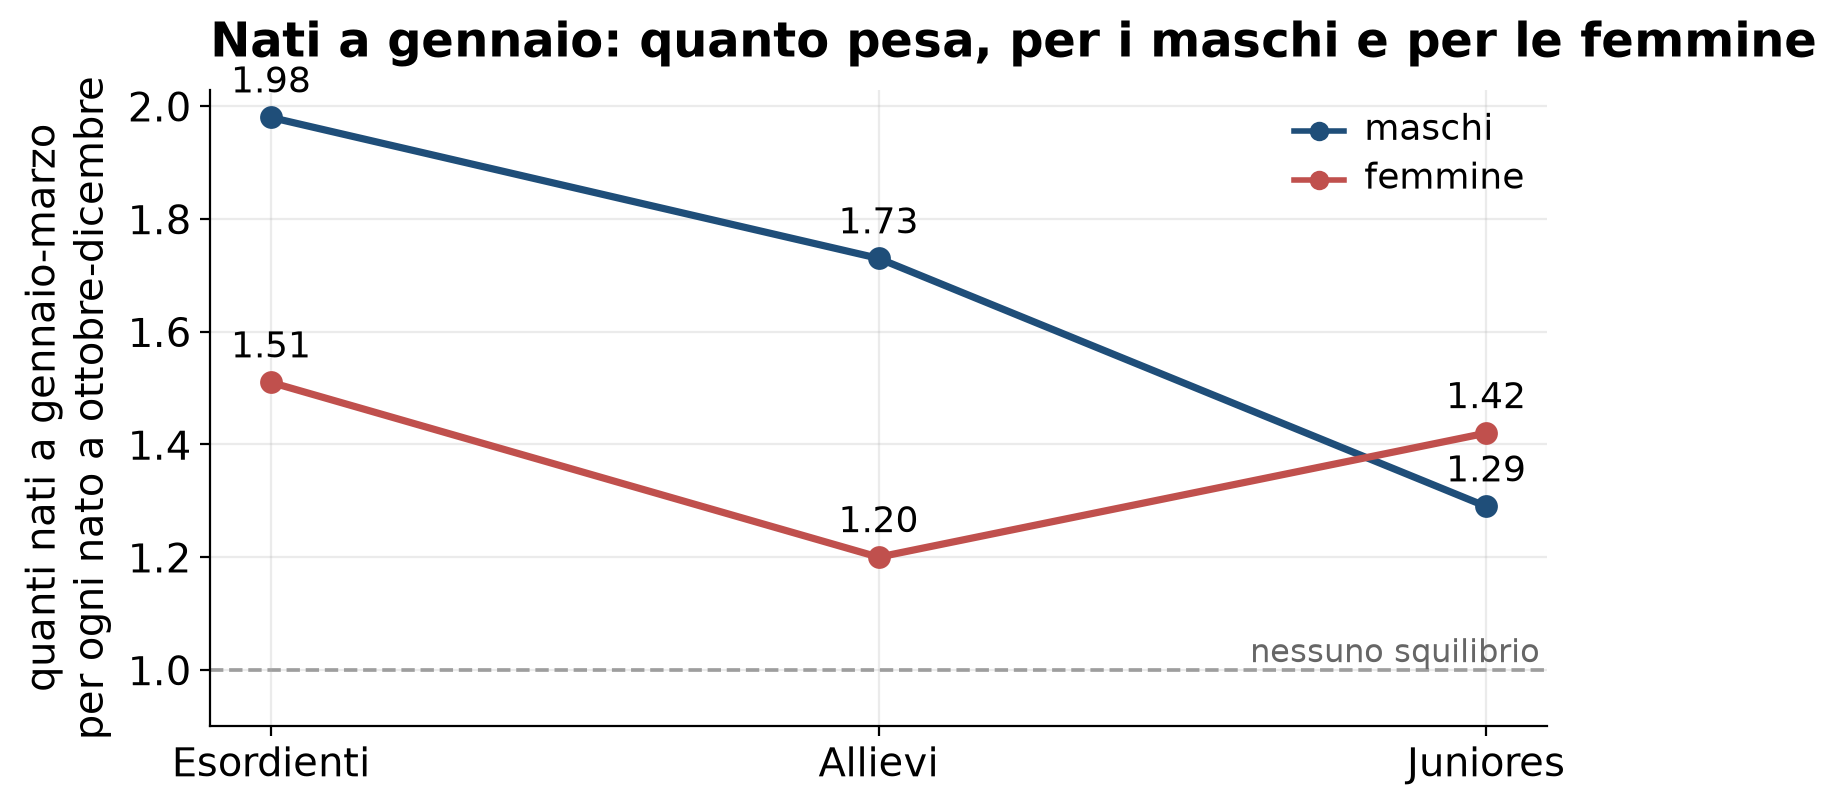
At thirteen the imbalance is present among girls but weaker than among boys. Later female estimates rest on a few hundred riders and follow no consistent trajectory.
This is indirect corroboration: men’s and women’s cycling differ in many ways beyond the timing of puberty. Nevertheless, the female population provides a check on a male finding: maturation differences explain why a January birthday matters, and why it later stops mattering.
Exactly how much the ranking matters
A model lets us put a number on the advantage: what difference do ten percentile points make3?
| category | age | odds multiplier |
|---|---|---|
| first-year Esordienti | 13 | ×1.40 (1.25–1.57) |
| second-year Esordienti | 14 | ×1.56 |
| first-year Allievi | 15 | ×1.70 |
| second-year Allievi | 16 | ×1.98 |
| first-year juniors | 17 | ×1.64 |
| second-year juniors | 18 | ×2.28 (1.91–2.80) |
| first-year Under 23 | 19 | ×1.32 |
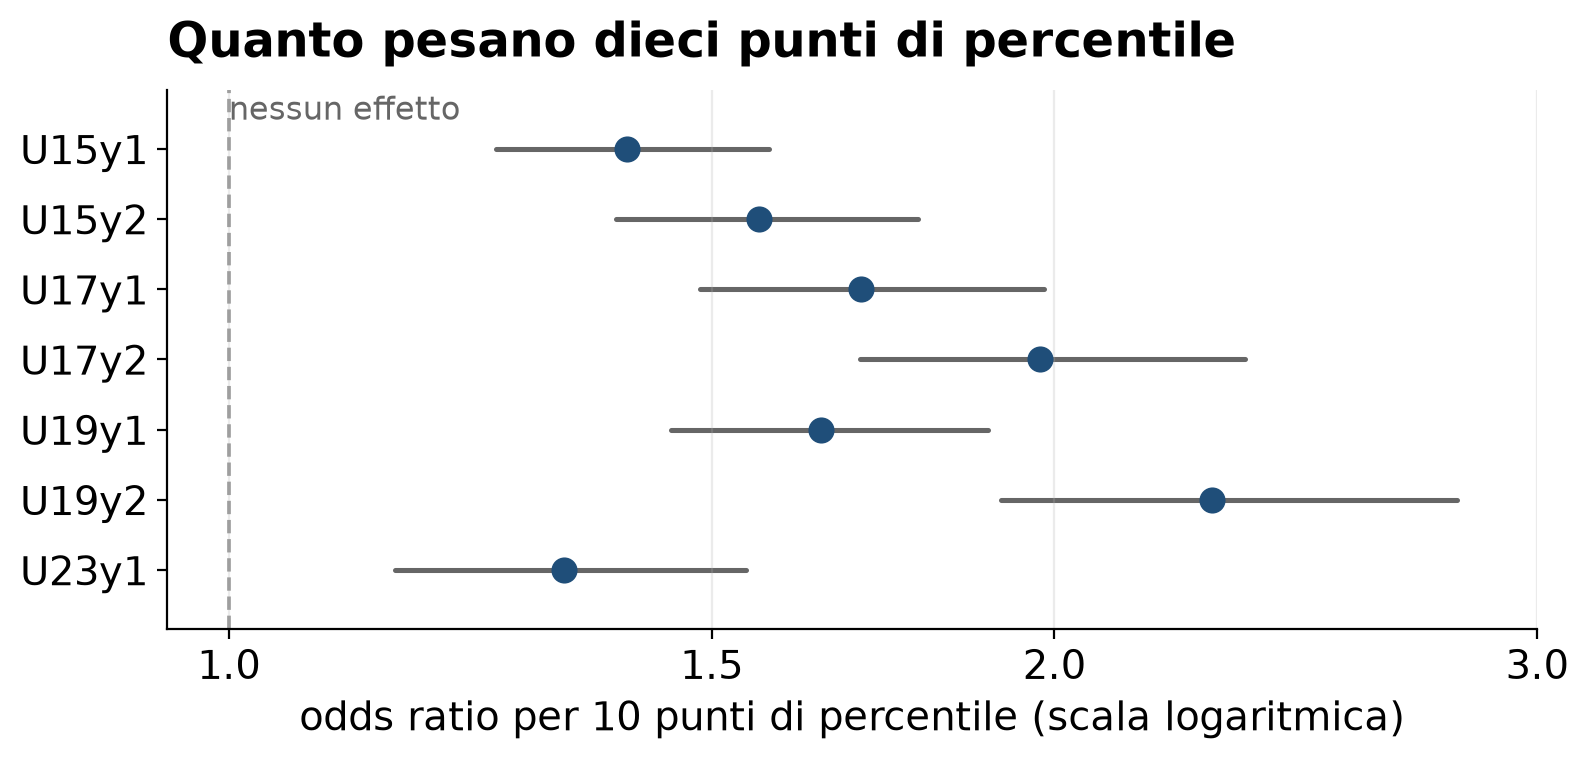
Each row is a separate model, with a 95% interval on a logarithmic scale: odds ratios are read as ratios, not differences.
How should you read this table? The multiplier applies to odds, not probability. Of two Esordienti ten percentile points apart, the higher-ranked rider has 40% higher odds of becoming professional: the ratio of their probability of making it to their probability of not making it is 1.40 times the other’s. With an outcome this rare, probability also rises by almost 40%. But that does not mean forty percentage points: in practice it rises from about 2.7% to about 3.7%, one point higher.
The effect grows with age, from 1.40 to 2.28, but not steadily. The two downward steps should not be read as weaker signals: the population changes at each category transition. Among first-year juniors, future professionals already make up 9.7% of the list, against 4.5% in the preceding cell; among Under 23s they are 37%. Comparing these figures as though they measured the same thing is already a misreading.
For more detail in the technical document, in Italian: Why the ‘% pro’ column is not a signal.
Another detail looks like a finding but is not. In categories with a single list, future professionals make up a larger share in the first year than the second, as though the first year selected better. As explained in the first instalment, however, first-year point-scoring places are scarce, with an average of 181 ranked riders against 320. Those present are already more selected, and a more selected group necessarily contains a larger share of future professionals. Does the first year predict better? Only comparing the same people can answer that, and the answer is no: the second year discriminates better in every category, 81% against 70% for Esordienti, 85% against 81% for Allievi and 87% against 78% for juniors.
What more recent results add
Allievi placings help predict future professionals. But how much do they add to what Esordienti results already told us?
Take the 102 riders ranked in every category. They form a small, highly selected group, but allow predictions to be compared on the same athletes. Begin with birth year alone, then add results from Esordienti, Allievi, juniors and finally Under 23s, measuring the predictive gain at each step4.
| the model knows… | discrimination | interval |
|---|---|---|
| birth year alone | 51% (essentially nothing) | 40–62% |
| plus Esordienti | 58% | 46–69% |
| plus Allievi | 66% | 55–77% |
| plus juniors | 81% | 73–89% |
| plus Under 23 | 82% | 74–90% |
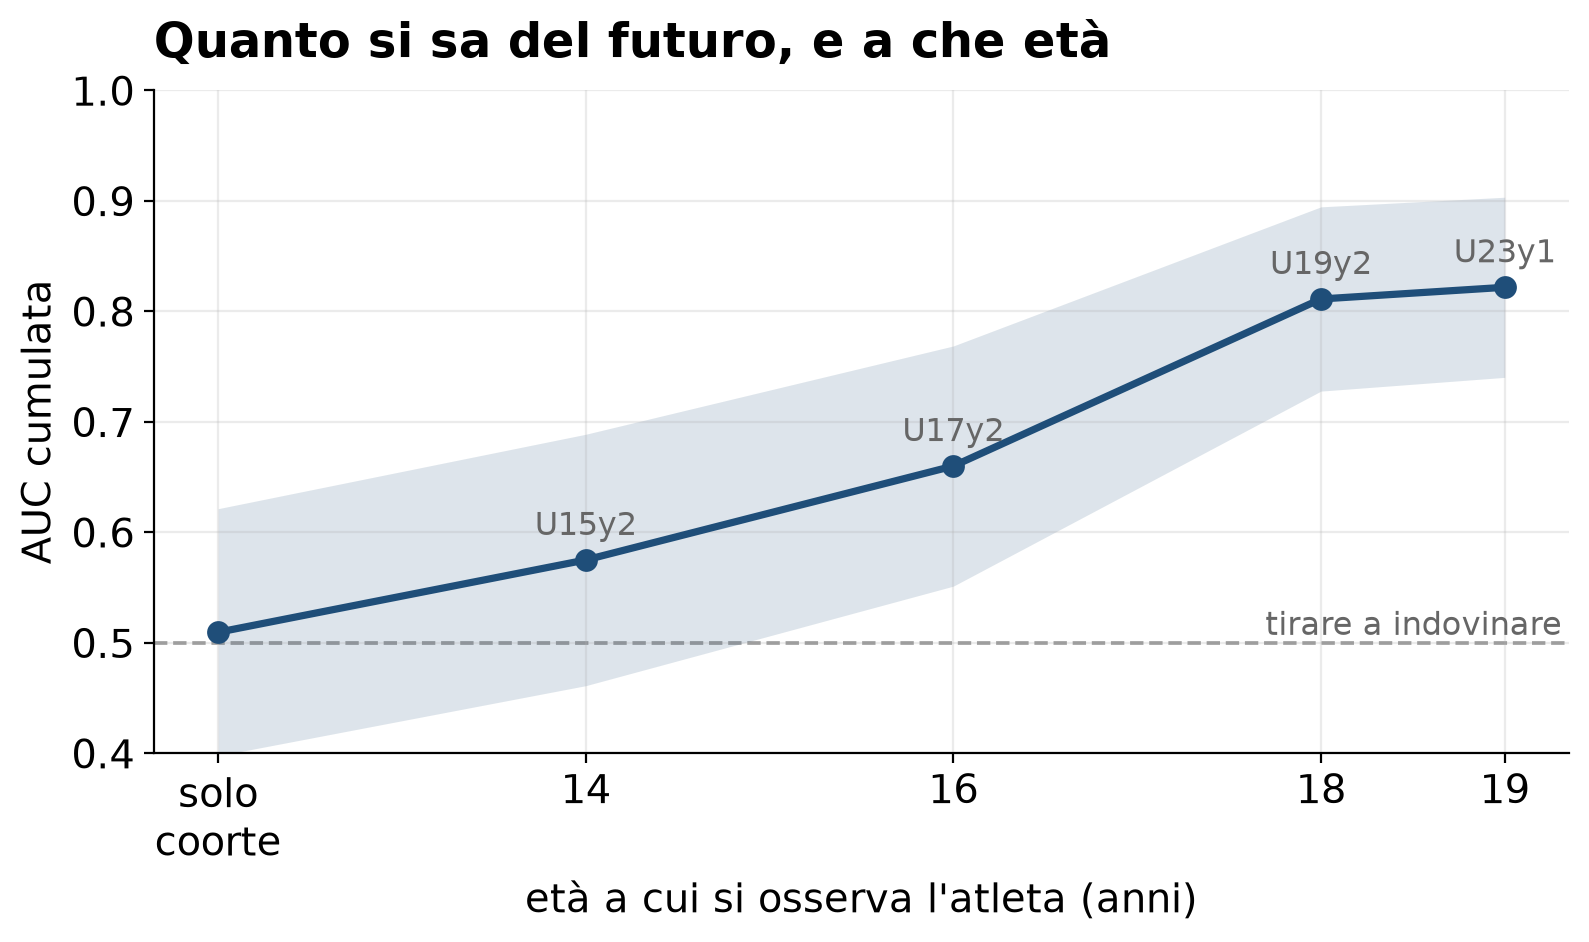
The comparison works because it always uses the same 102 riders. Changing groups at each step would measure who remained, not added information.
The third column, sometimes dispensable, matters here: intervals are sixteen to twenty-three points wide, and the first three overlap extensively. Only one step clearly stands apart, the junior one. Juniors alone add as much as all earlier categories combined, and this is the only step whose improvement is distinguishable from chance.
Do not turn non-significant steps into zeros, however. Esordienti and Allievi improve model fit beyond what chance would explain; they simply do not change the order in which riders are ranked. These are different questions: one asks how well the model agrees with the data, the other whether it puts the right rider first in a pair.
That might have been peculiar to this subsample, so I asked the same question in two other ways. A random forest, an algorithm that finds useful combinations for itself, received seventeen variables instead of the simple model’s two and gained 2.0 percentage points of discrimination. Junior placing ranked highest in importance. A penalised regression, putting all categories in one model and discarding those that do not earn their place, retained 2 out of 8: second-year juniors and Under 23.
Three different routes, the same conclusion: almost all useful information lies in the latest measurement. Earlier seasons do not simply add to it; they largely show the same thing from further away.
For more detail in the technical document, in Italian: How similar the categories are, Would a more complicated model do better? and What if all categories were used together?.
What if unranked riders counted too?
This study counts only ranked riders. An alternative is to treat absence as worse performance than any ranked placing. I tried that too.
The answer depends on age in a way I did not expect. At eighteen, putting absent riders at the bottom raises discrimination from 89% to 94%. By then absence is a strong signal: only 3 of the 77 future professionals were unranked. At thirteen it lowers discrimination from 74% to 69%, because only 59 of the 77 were ranked then; the other eighteen would be placed at the bottom despite eventually making it5.
Absence is information, but only later. This is a more precise version of a point from the first instalment: a name missing from a ranking has not necessarily been rejected, and almost a third of those who disappear return.
For more detail in the technical document, in Italian: Do the conclusions depend on design choices?.
What remains
Results at thirteen carry information. Anyone denying that out of caution is saying something kind but false. When you look at your Esordienti’s placings, you are looking at something associated, on average, with their future within the observed population.
I would not read that as ‘the literature was wrong’. Earlier studies suggested a weak signal at young ages, and both findings can coexist: this sample is Italian, large and not restricted to internationally competitive riders, precisely the kind of population in which an early signal has room to appear.
And birth date does not explain it. Being born in January helps riders enter the ranking, not become professionals: selecting at thirteen partly means selecting birth dates, to no useful end.
What does this mean in practice? For predicting professional careers, recent results matter far more than results three years earlier. Past results may answer another question, though: is the rider improving or declining? That is the subject of the next instalment (forthcoming).
How we know
The predictor is the percentile within each
season × category × year within categorycell, making rankings of different lengths comparable. The outcome is having raced for a first- or second-tier professional team by twenty-five.Models are logistic regressions with Firth’s correction, needed because the outcome is rare, below 3%, and uncorrected estimates would be biased upwards. They adjust for birth year because recent cohorts have had less time to make it; the adjustment changes coefficients by less than 0.01.
Pair percentages express the area under the ROC curve in plain language: the share of future-professional/non-professional pairs in which the model ranks the right rider ahead.
Calculated in report/moduli/punteggi.py. ↩︎ ↩︎
Calculated in report/moduli/rae.py. Expected births come from Eurostat table
demo_fmonth. ↩︎ ↩︎Models in R/16_univariati.R, rendered by report/moduli/univariati.py. ↩︎
Models in R/18_annidati.R. Random forest in R/27_confronto_ml.R, penalised regression in R/17_penalizzato.R. ↩︎
Sensitivity analysis in scripts/10_sensibilita.py. ↩︎